Test reporters
Test reporters are used to collect test progress and display a summary after the tests have been executed.
A test reporter can choose the format and the destination where it wants to display the progress and the summary. For example, the spec reporter writes colorful ANSI output to the terminal.
Registering and activating reporters
The reporters are registered within the Japa entry point file, i.e., bin/test.js using the configure method.
By default, the following reporters are registered inside the list array, and only the spec reporter is activated.
The defaults will be removed if you define the reporters property inside the configuration block. So, make sure to register and activate the reporters you want to use when configuring them manually.
import { configure } from '@japa/runner'
import * as reporters from '@japa/runner/reporters'

configure({
  reporters: {
    activated: [
      'spec'
    ],
    list: [
      reporters.spec(),
      reporters.ndjson(),
      reporters.dot(),
      reporters.github(),
    ],
  }
})
Activating using command-line
You can activate/switch between the reporters from the command line using the --reporters CLI flag. However, ensure the reporter is registered on the list before you can activate it.
node bin/test.js --reporters=dot
node bin/test.js --reporters=ndjson
You will get the following error if you try to activate a non-registered reporter.
node bin/test.js --reporters=list

# Error: Invalid reporter "list". Make sure to register it first inside the "reporters.list" array.
The spec reporter
The spec reporter displays the test output in the terminal as a colorful output, as shown in the following screenshot.

The dot reporter
The dot reporter displays the test output only using the icons and without titles.

The ndjson reporter
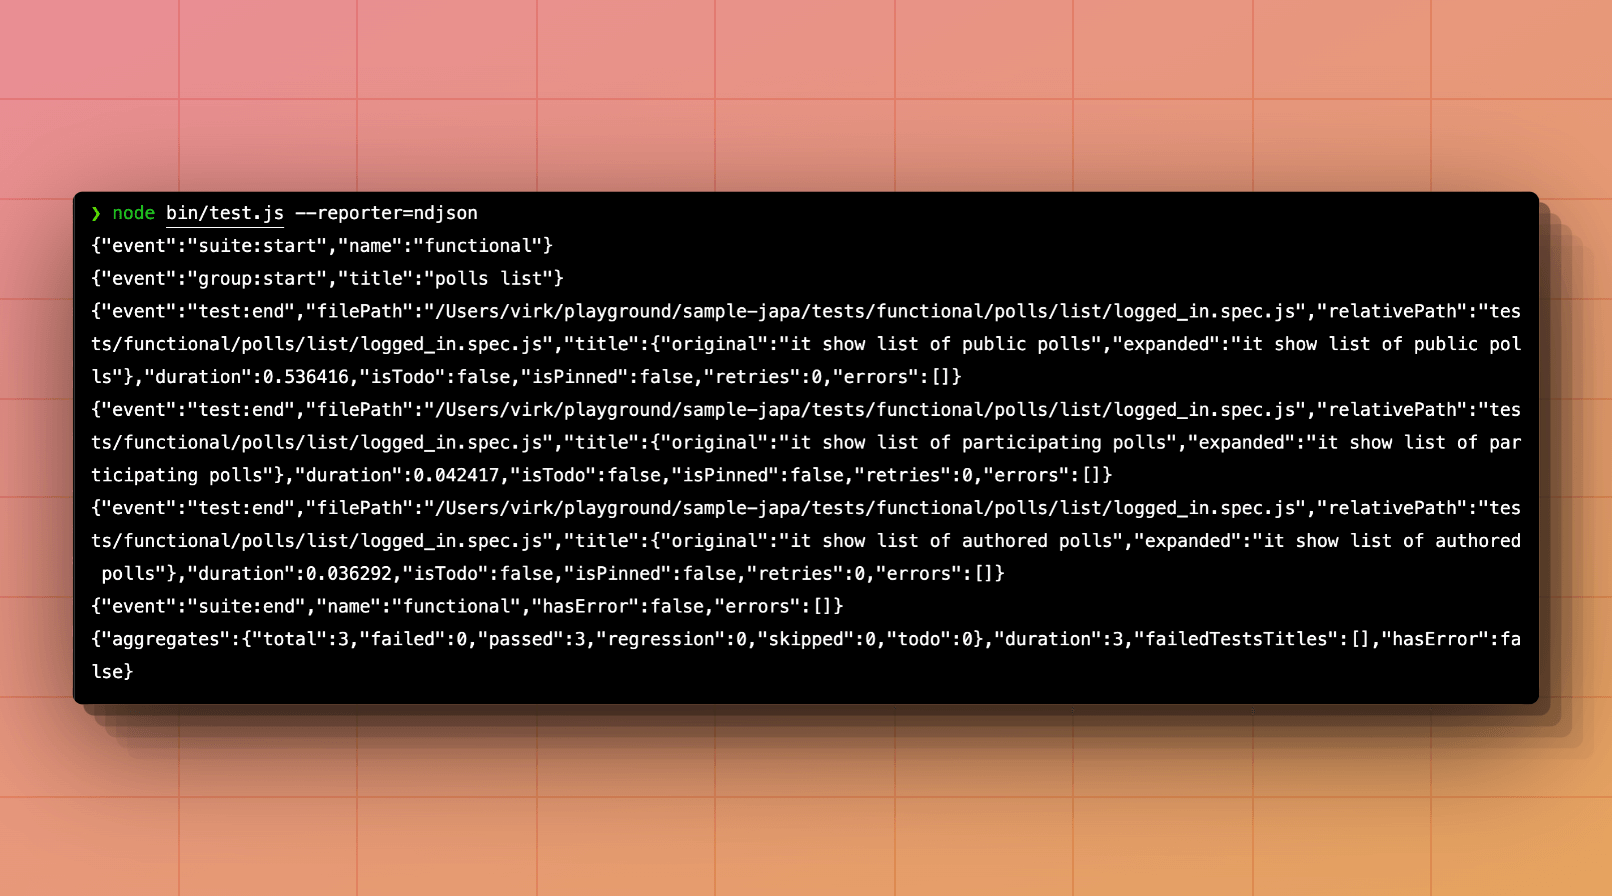
The ndjson reporter outputs each event as a valid JSON string to the terminal. The JSON output is an excellent fit for programmatic use cases.

The github reporter
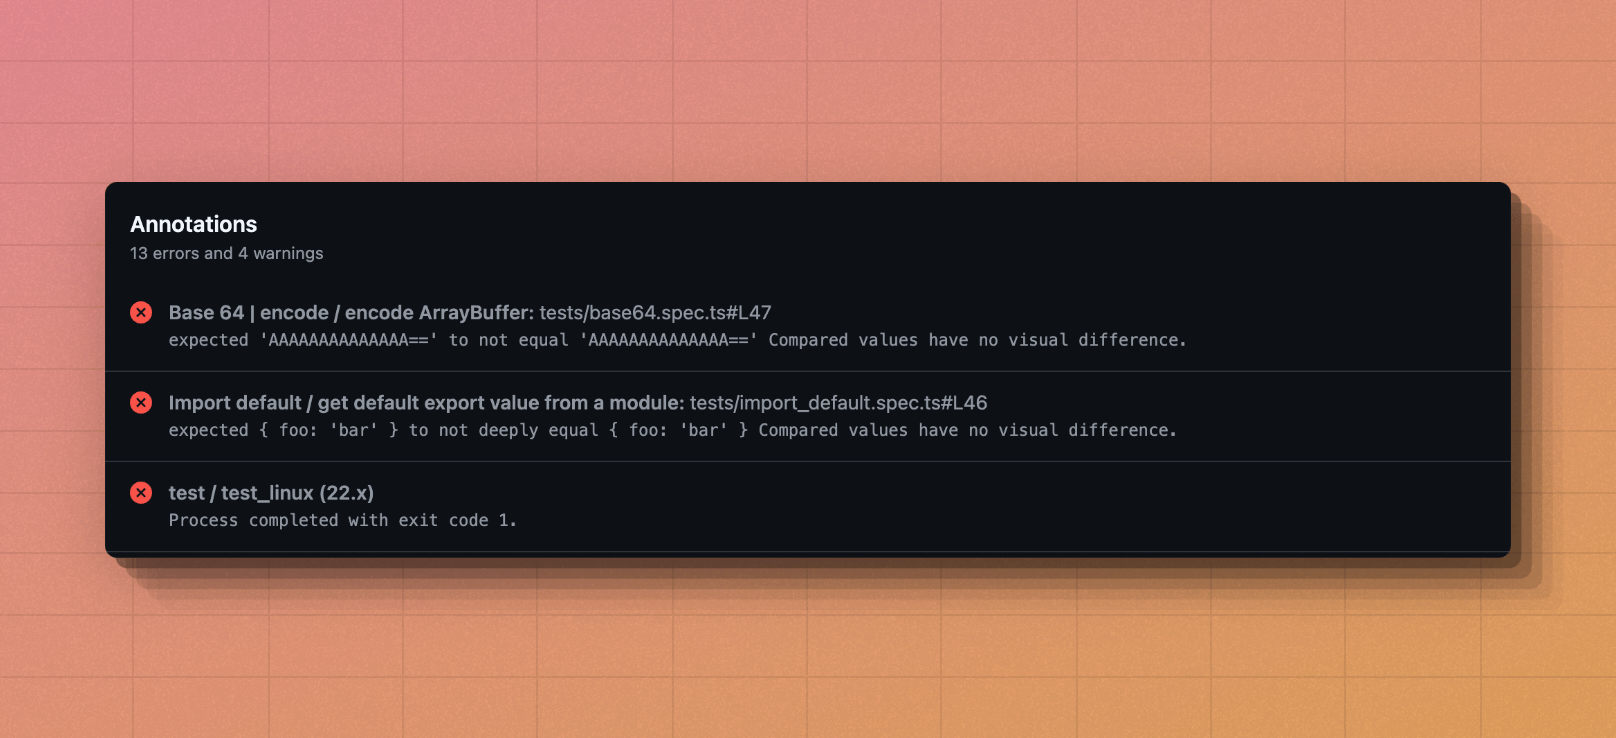
The github reporter reports errors as annotations when running tests as part of Github actions.

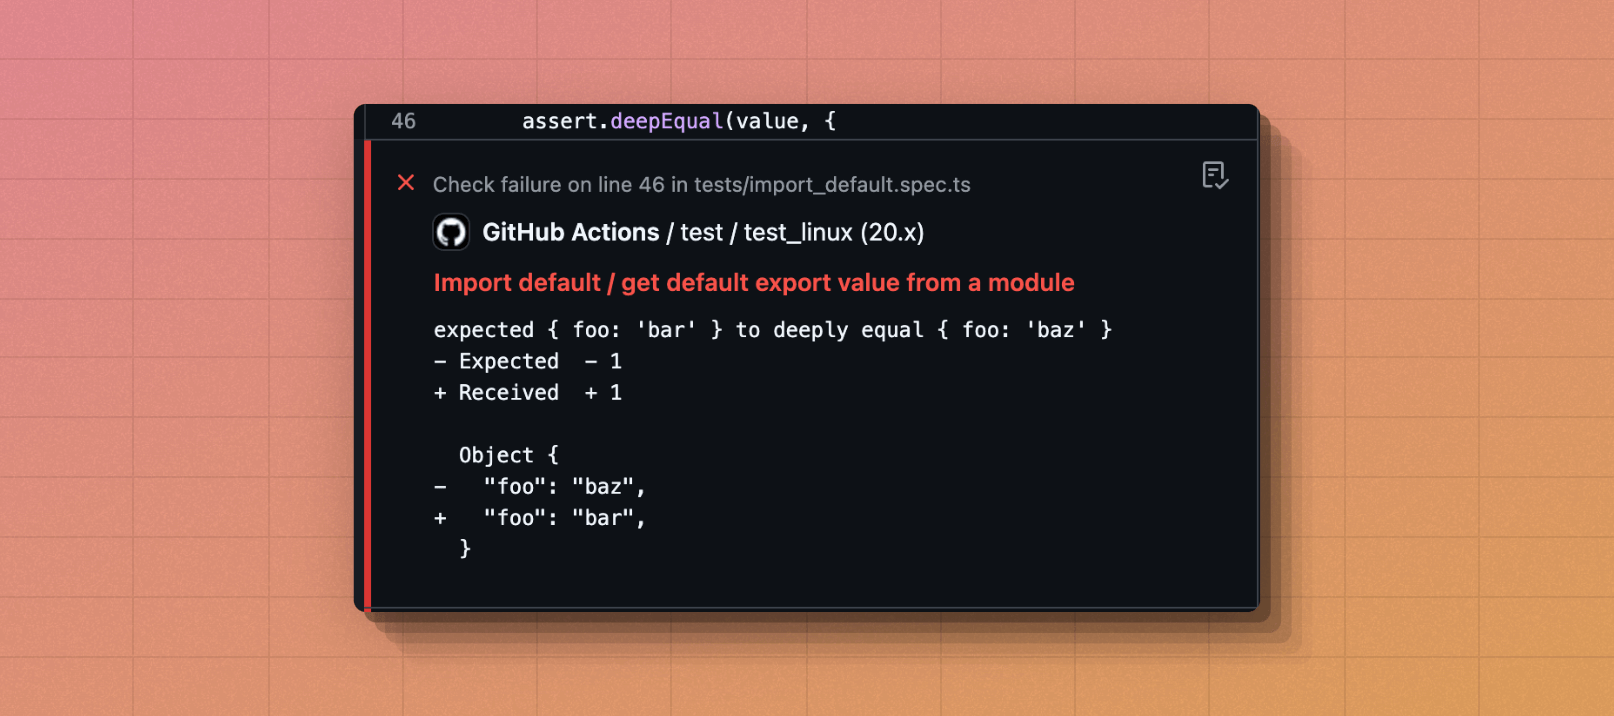
You can view individual errors by clicking on the annotation and Github will take you to the source file and display the error as follows.

The reporter is activated automatically in the Github actions environment. However, if you have overridden the reporters property inside the config, then you must enable it manually.
import { configure } from '@japa/runner'
import * as reporters from '@japa/runner/reporters'

/**
 * The following code is only needed when you have decided to
 * override the "reporters" property in the config file.
 */
const activated = ['spec']
if (process.env.GITHUB_ACTIONS === 'true') {
  activated.push('github')
}

configure({
  reporters: {
    activated,
    list: [
      reporters.spec(),
      reporters.ndjson(),
      reporters.dot(),
      reporters.github(),
    ],
  }
})
Creating a custom reporter
You can create and register custom test reporters with Japa. A test reporter must extend the BaseReporter class and register it as an object within the configuration block.
Defining a reporter
Let's start by creating a reporter class. You can implement the following methods to listen for different events emitted during the test lifecycle.
See also: BaseReporter source code
import { BaseReporter } from '@japa/runner/core'

class MyCustomReporter extends BaseReporter {
  static name = 'custom'

  onTestStart(testPayload) {
    console.log('test started "%s"', testPayload.title)
  }
  onTestEnd(testPayload) {
    console.log('test completed "%s"', testPayload.title)
  }

  onGroupStart(groupPayload) {
    console.log('group started "%s"', groupPayload.title)
  }
  onGroupEnd(groupPayload) {
    console.log('group ended "%s"', groupPayload.title)
  }

  onSuiteStart(suitePayload) {
    console.log('suite started "%s"', suitePayload.name)
  }
  onSuiteEnd(suitePayload) {
    console.log('suite completed "%s"', suitePayload.name)
  }

  async start() {
    console.log('starting')
  }
  async end() {
    console.log('completed')
  }
}
Registering custom reporter
Once you have defined a custom reporter, register it in the Japa entry point file.
configure({
  reporters: {
    activated: [MyCustomReporter.name],
    list: [
      {
        name: MyCustomReporter.name,
        handler: (...args) => new MyCustomReporter().boot(...args),
      }
    ]
  }
})
Accessing the test summary
Once all the tests have been executed, you can access the test summary within the end method using the this.runner.getSummary method.
class MyCustomReporter extends BaseReporter {
  async end() {
    const summary = this.runner.getSummary()
    console.log(summary)
  }
}
The summary has the following properties.
{
  aggregates: {
    total: 3,
    failed: 0,
    passed: 3,
    regression: 0,
    skipped: 0,
    todo: 0
  },
  hasError: false,
  duration: 4,
  failureTree: [],
  failedTestsTitles: []
}
-
hasError
-
A boolean to know if one or more errors occurred during the test lifecycle.
-
duration
-
The total of milliseconds spent between executing the first and the last test. This duration does not account for booting the Node.js process and importing the test files.
-
failureTree
-
A nested tree of errors containing information about the suite, group, and the test that raised the error. The top-level node will always be a suite.
The
errorsproperty will hold the errors raised within the suite hooks (if any). Otherwise, you must loop over the children and check for nested errors.{name: 'functional',type: 'suite',errors: [],children: [Array]}The children's array may contain objects for
type = grouportype = test.The
errorsproperty will hold the errors raised within the group hooks (if any). Otherwise, you must loop over the children to check for errors within tests.{name: 'polls list',type: 'group',errors: [],children: [ [Object] ]} -
failedTestTitles
-
A flat array containing the titles for failed tests.
-
aggregates
-
An object with additional properties contains the number of total tests, failed tests, regression tests, etc.
Printing the test summary
You may use the this.printSummary method to print the summary to the terminal with formatting and colors.
class MyCustomReporter extends BaseReporter {
  async end() {
    const summary = this.runner.getSummary()
    await this.printSummary(summary)
  }
}